

Intro
Running out of memory is never fun, but it's incredibly frustrating when you've already taken some precautions and calculated your exact memory needs. "My application requires 4GB of memory. How is it possible I ran out of memory on my 6GB machine!?". As it turns out, this was a real possibility in a garbage collected ("GC") language like Golang. The emphasis is on the word "was" because Go 1.19 changes everything: The new GOMEMLIMIT feature can help you both increase GC-related performance as well as avoid GC-related out-of-memory ("OOM") situations.
In this article, I will invite you on a journey. We will cover:
- How memory allocations work in Go.
- When the Garbage Collector runs, and what the implications are.
- Why it was far too easy to run out of memory before Go 1.19.
- What GOMEMLIMT is and why it can prevent premature OOM kills.
- Run an experiment first without and then with GOMEMLIMIT
What is a garbage-collected language?
In a garbage-collected language, such as Go, C#, or Java, the programmer doesn't have to deallocate objects manually after using them. A GC cycle runs periodically to collect memory no longer needed and ensure it can be assigned again. Using a garbage-collected language is a trade-off between development complexity and execution time. Some CPU time has to be spent at runtime to run the GC cycles.
Go's Garbage collector is highly concurrent and quite efficient. That makes Go a great compromise between both worlds. The syntax is straightforward, and the potential for memory-related bugs (such as memory leaks) is low. At the same time, it's not uncommon to have Go programs spend considerably less than 1% of their CPU time on GC-related activities. Given how little the average program is optimized for execution efficiency, trading in just 1% of execution time is a pretty good deal. After all, who wants to worry about freeing memory after it's been used?
However, as the next few paragraphs show, there are some caveats (and a terrific new solution called GOMEMLIMIT). If you aren't careful, you can run OOM even when you shouldn't. But before we dive into this, we need to talk about stack and heap allocations and why something ends up on the heap.
The stack vs. the heap
In short, there are two ways to allocate memory: On the stack or the heap. A stack allocation is short-lived and typically very cheap. No Garbage Collection is required for a stack allocation as the end of the function is also the end of the variable's lifetime. On the other hand, a heap allocation is long-lived and considerably more expensive. When allocating onto the heap, the runtime must find a contiguous piece of memory where the new variable fits. Additionally, it must be garbage-collected when the variable is no longer used. Both operations are orders of magnitudes more expensive than a stack allocation.
Let's look at two simple examples. The first is a function that takes in two numbers, squares them, and returns the sum of the squares:
func SumSquares(a, b float64) float64 {
  aSquared := a * a
  bSquared := b * b
  return aSquared + bSquared
}
Admittedly, this function is a bit more verbose than it would have to be. That is on purpose to show a lot of variables that can live on the stack. There are four variables (a, b, aSquared, and bSquared). None of them "escape" outside of this function block. As a result, the Go runtime can allocate them on the stack. In other words, these allocations are cheap. The garbage collector will never know about them.
Now, let's look at something that escapes onto the heap. An example application would be a cache. A cache is long-lived and needs to stick around – even after a specific function that interacts with the cache has returned. For example:
var cache = map[string]string{}

func Put(key, value string) {
  cache[key] = value
}
In the above example, the cache variable is allocated on the heap. It exists before Put is called and after Put has returned. That is by no means the only criterion for why something escapes to the heap, but it should be enough for our purposes of understanding GC-related OOM situations.
When things accidentally escape to the heap
The previous examples have shown two distinct cases: Short-lived allocations which end on the stack and long-lived allocations which end up on the heap. In reality, it's not always this simple. Sometimes you will end up with unintentional heap allocations. You allocate a variable that you believe should be short-lived, yet it is allocated on the heap anyway. Why and how that happens is a blog post on its own. It is one of my favorite topics about Go memory management, and I'd be happy to write this post. Please let me know. For this one, it's enough to understand that sometimes heap-allocations happen even when we think they shouldn't. That is important to know because those allocations will put pressure on the GC, which is required for an unexpected OOM situation.
Why would you run OOM – even when there is enough memory available?
In the previous sections, we outlined that most applications have short-lived and long-lived memory. Long-lived memory is something you can estimate upfront or control at runtime. For example, if you wanted to extend the simple cache example above to a full-blown cache application, you would most likely implement some sort of a limit. Either the cache would stop accepting new values when it's full or start dropping old ones. You could make sure that the cache never exceeds 4GB in size. Then you should be safe on your 6GB machine, right? The answer is maybe. But "maybe" is not enough when the risk is of running out of memory.
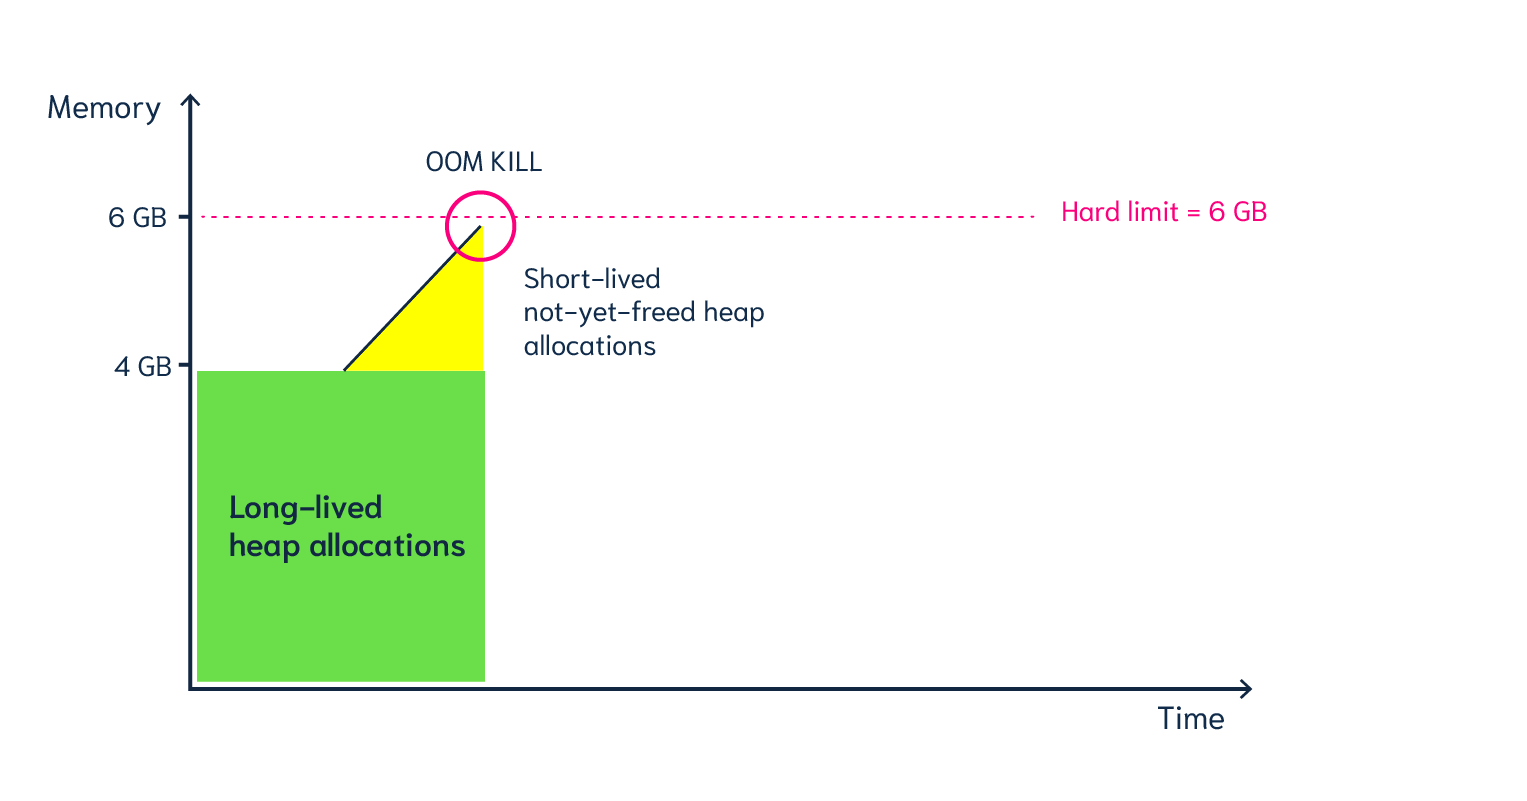
To understand why it is possible to run OOM in this situation, we need to look at when the Garbage collector runs. Let's first think of an example where it never runs. We know that we have 4GB of live memory, and - simply from using the application - we add a few short-lived heap allocations here and there. We do not expect them to stick around long-term, but since there is no GC cycle running at the moment, they will never be freed, either. Eventually, we will run OOM when the intentional and unintentional live heap exceeds 6GB:
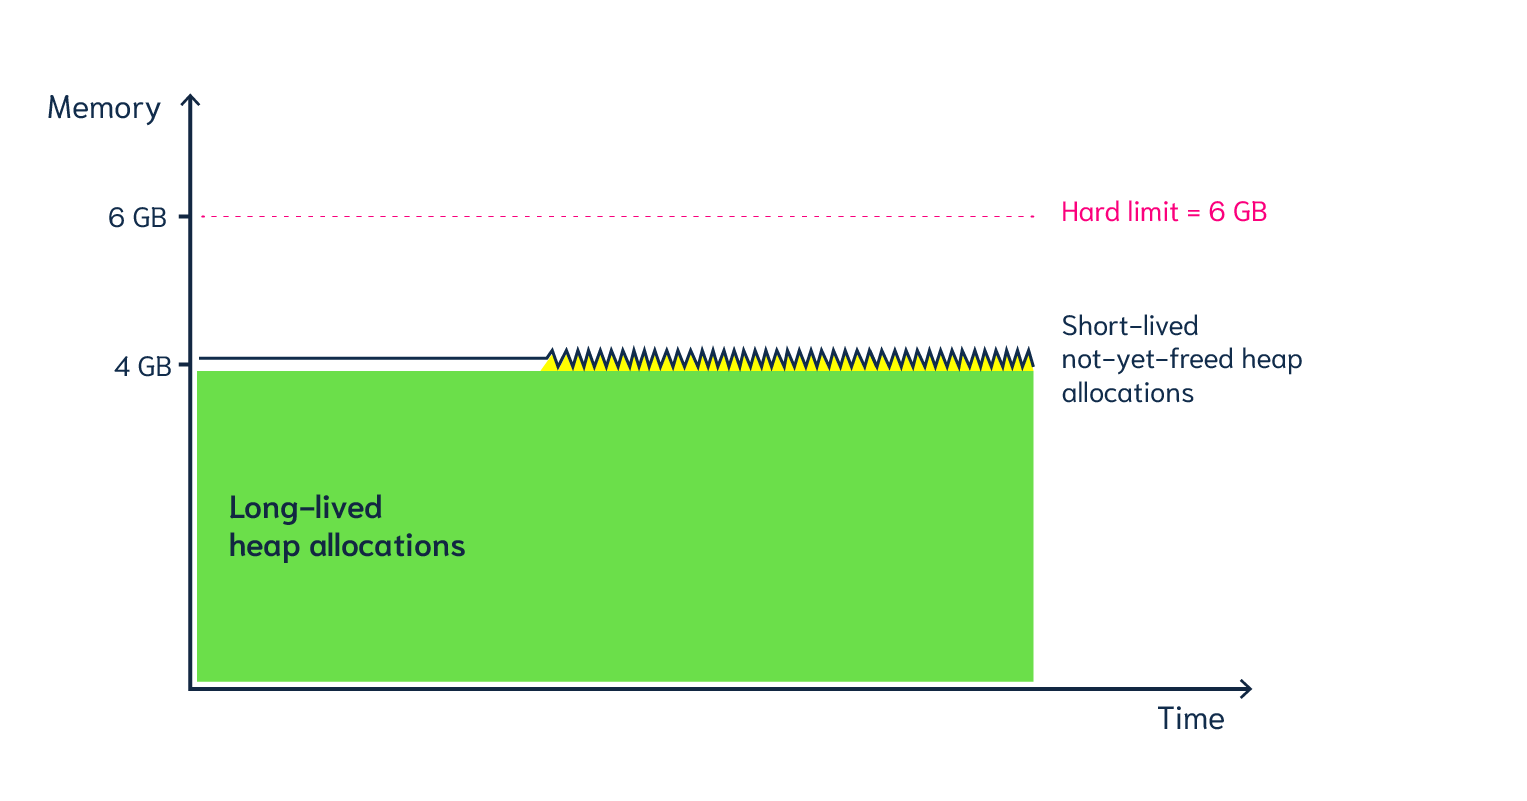
Now let's look at the other extreme. Let's say the Garbage Collector runs extremely frequently. Any time our heap reaches 4.1GB, it runs and removes the 100MB of temporary allocations. An OOM situation is improbable now, but we have far exceeded our cost target. Our application might now spend 25-30% (or more) on GC. In other words, it is no longer efficient:
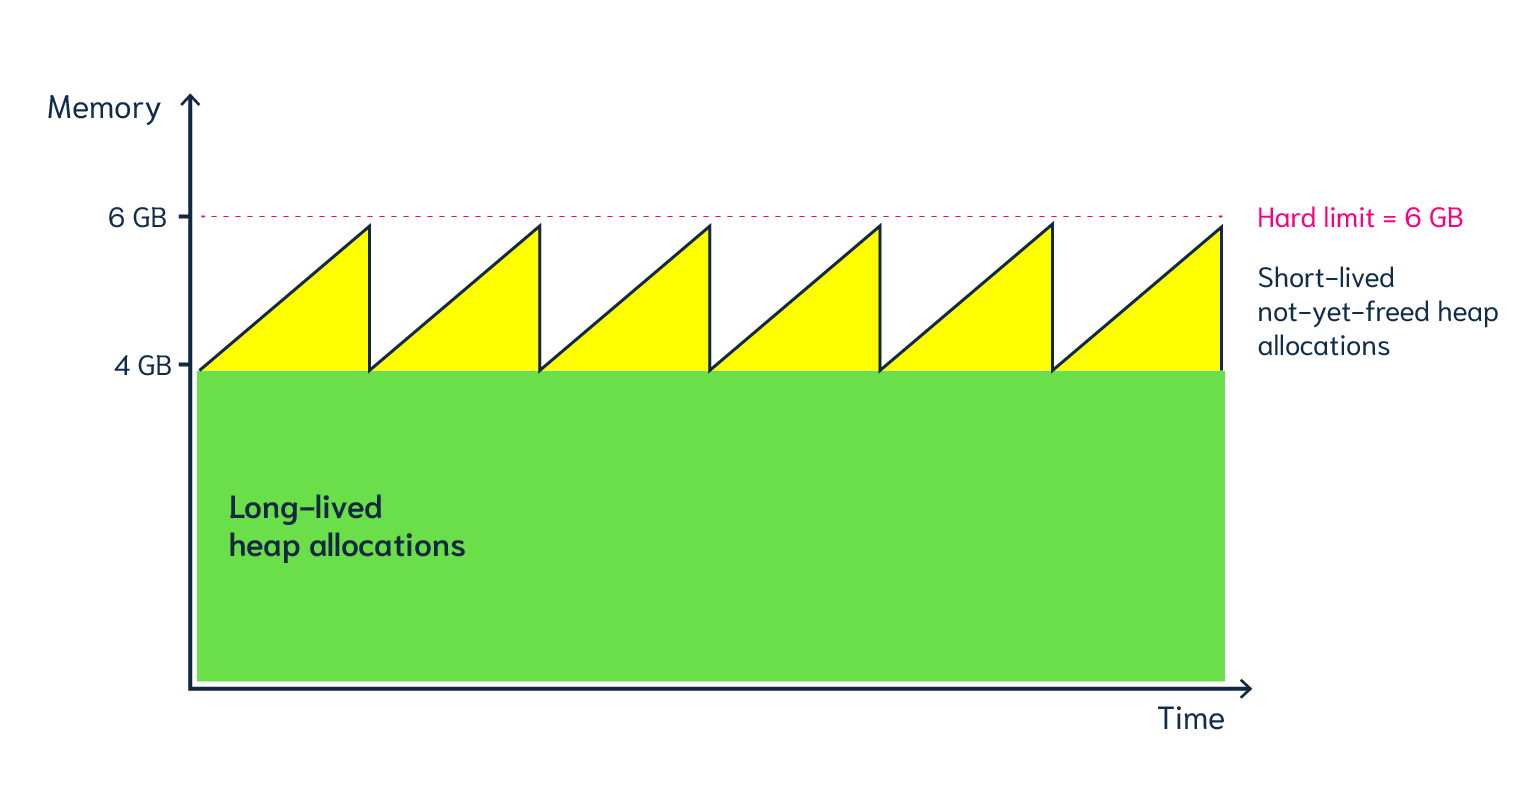
So, we want the best of both worlds; to get as close to our limit as possible but never beyond it. This way, we can delay GC cycles until they are really necessary. That makes our program fast. But at the same time, we can be sure that we never cross the threshold. That makes our program safe from being OOM-killed. In other words, our ideal situation would look something like the following:
Previously GC targets were always relative.
Looking at the three graphs above, you might think this is pretty obvious. We want to make use of the memory we have without going above it. However, before Go 1.19, you only had a single knob to turn: the GOGC environment variable. This variable accepted a relative target compared to the current live heap size. The default value for GOGC is 100, meaning that the heap should double (i.e. grow by 100 percent) before GC should run again.
That works well for applications that have tiny permanent live heaps. For example, if your constant heap is just 100MB and you have 6GB available, you can double your heap targets many times before ever being in danger. If your application load increases and temporary allocations increase, your dynamic targets would be 200MB, 400MB, 800MB, 1600MB, and 3200MB. Your load must double six times to cross the 6GB mark. In other words, running out of memory is extremely unlikely.
But now, let's think back to our cache application with a permanent 4GB live heap on a 6GB machine. Even the first doubling of the heap is highly problematic because the new target (8GB) would already exceed the physical memory on the machine.
In the past, there was not much we could do about this. Remember, GOGC is the only knob that we could turn. So we would have most likely picked a value such as GOGC=25. That means the heap could grow by 25% for GC to kick in. Our new target would now be 5GB; unless the load changes drastically, we should be safe from running OOM again.
But this scenario only looks at a single snapshot in time. We have pretended that we would always start with a 4GB live heap. That's an over-simplification that won't always hold in reality. What if fewer items are in the cache and the live heap is only 100MB? That would make our heap goal just 125MB. In other words, we would end up with constant GC cycles. They would take up a lot of CPU time. As a result, user-facing latencies – as well as the overall throughput – would suffer.
Be less aggressive when there is a lot of memory, be very aggressive when there is little.
What we want is a situation where the GC is not very aggressive (i.e., it runs rarely) when a lot of memory is still available, yet at the same time, the GC should become very aggressive when memory is scarce. In the past, this was only possible with a workaround. The so-called GC ballast method is a technique that the engineers at Twitch popularized. At the application startup, you would allocate a ballast, for example, a byte array that would take up a vast amount of memory. Since the heap is now significant, you can make GOGC quite aggressive. To stick with our numbers from above: If you allocate a 4GB ballast and set GOGC=25, the GC will not run until 5GB of memory is allocated.
You might be wondering if this exercise defeats the purpose? Yes, this will defer the first GC cycle, but don't we have 4GB of useless memory allocations on the heap now? The answer is "not really" because the ballast would only occupy virtual memory. This concept is explained well in the article from Twitch.
GOMEMLIMIT – no more need for a workaround
While I love the ingenuity of using virtual memory as ballast, it is still a workaround – one that you should never need in the first place. And with Go 1.19, we finally have a better solution. GOMEMLIMIT allows specifying a soft memory cap. It does not replace GOGC but works in conjunction with it. You can set GOGC for a scenario in which memory is always available. And at the same time, you can trust that GOMEMLIMIT automatically makes the GC more aggressive when memory is scarce. In other words, GOMEMLIMIT is precisely the missing piece that we outlined before.
If the live heap is low (e.g., 100MB), we can delay the next GC cycle until the heap has doubled (200MB). But if the heap has grown close to our limit (e.g., 4GB), the GC runs more often to prevent us from ever running OOM.
Why a soft limit? What is the difference between a soft and a hard limit?
The Go authors explicitly label GOMEMLIMIT a "soft" limit. That means that the Go runtime does not guarantee that the memory usage will exceed the limit. Instead, it uses it as a target. The goal is to fail fast in an impossible-to-solve situation: Imagine we set the limit to a value just a few kilobytes larger than the live heap. The GC would have to run constantly. We would be in a situation where the regular and GC execution would compete for the same resources. The application would stall. Since there is no way out – other than running with more memory – the Go runtime prefers an OOM situation. All the usable memory has been used up, and nothing can be freed anymore. That is a failure scenario, and fast failure is preferred. That makes the limit a soft limit. Crossing it - and thus invoking an OOM kill from the kernel – is still an option, but only when the live heap is used up entirely, and there is nothing else that the runtime can do.
Adding GOMEMLIMIT to Weaviate – before & after
Weaviate is a vector database that we are building. As a database provider, we care both about OOM safety as well as about performance. Using default settings, Weaviate will create an in-memory index for efficient vector-based retrieval. In other words, the more the user imports, the more the heap will grow. That makes it quite unpredictable to know what live heap we will end up with eventually. In other words, Weaviate – like any other memory-intensive Go application – is a perfect candidate to benefit from GOMEMLIMT. It also comes out of the box with Prometheus-compatible monitoring, so it should be easy to visualize the heap usage.
For this experiment, we will use the latest Weaviate version compiled with Go 1.19. We will run it in Docker, making it very easy to limit the available memory. Based on what we are about to import, we will predict that the live heap should be around 3GB.
Without GOMEMLIMT
For the first run, I have chosen the following settings: GOMEMLIMIT is not set at all, GOGC is set to 100. Using Docker, the memory limit is set to 3GiB. The goal is to import 400,000 objects, each with a 768d vector attached.
Based on our predictions, this should use just above 2GiB of live memory. Will we run out of memory?
Here's the command to start up a Weaviate instance with the parameters described above:
docker run -it \
  -m 3GiB \
  -e "GOGC=100" \
  -e "PERSISTENCE_DATA_PATH=/var/lib/weaviate" \
  -e "AUTHENTICATION_ANONYMOUS_ACCESS_ENABLED=true" \
  -e "PROMETHEUS_MONITORING_ENABLED=true" \
  -e "CLUSTER_HOSTNAME=node1" \
  -e "GODEBUG=gctrace=1" \
  -v "$PWD/data:/var/lib/weaviate" \
  -p "8080:8080" \
  -p "2112:2112" \
  weaviate
A few side notes on the above command:
- I have explicitly set
GOGCto 100; this would have also been the default if I had not set it. - I have enabled
GODEBUG=gctrace=1. That makes the GC more verbose. It will log every time it runs. Each log message prints both the current heap size and the new target. - I have enabled Prometheus monitoring using
PROMETHEUS_MONITORING_ENABLED=trueand exposed the metrics port on port 2112. I am also running a Prometheus and Grafana instance. How to set up those is out of the scope of this article, but there is an excellent end-to-end Weaviate Prometheus Example here.
It is now time to start our import and see what happens. As predicted, I was not able to import all objects. After around 240,000 out of 400,000 objects, the dreaded OOM kill happened:
"State": {
            "Status": "exited",
            "Running": false,
            "Paused": false,
            "Restarting": false,
            "OOMKilled": true,  <===============
            "Dead": false,
            "Pid": 0,
            "ExitCode": 137,
            "Error": "",
        },
So, what does the heap chart look like that we get from the monitoring?
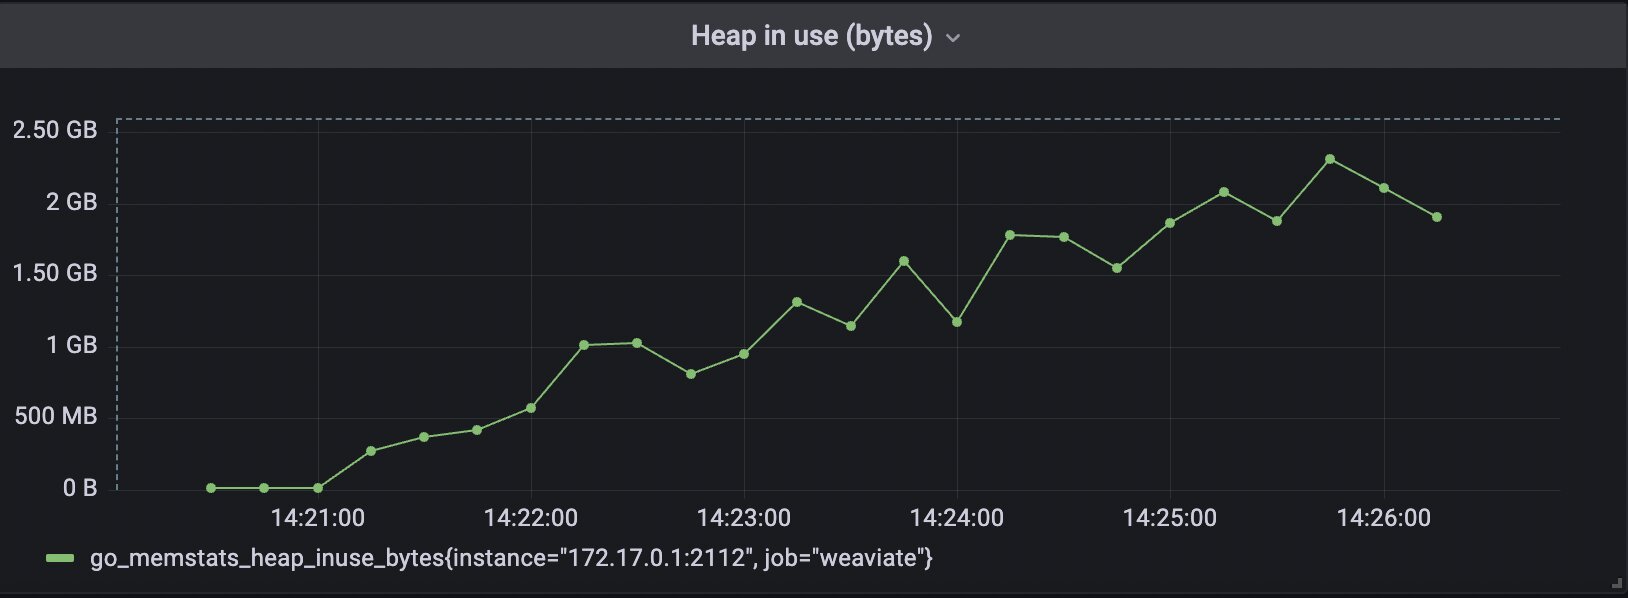
This is typically the point where everyone says, "I couldn't possibly have been OOM-killed. Look at the heap graph; we never exceeded 2.5GiB". And they'd be both right and wrong at the same time.
Indeed, the long-lived heap never exceeded the 3GiB hard limit. But what is hidden by the monitoring's sampling rate becomes visible through the GC logs. The following is the last line it was able to log before the kernel sent the kill signal:
gc 178 @351.109s 1%: 0.61+416+0.21 ms clock,
9.8+8.7/1629/695+3.4 ms cpu,
2549->2721->1575 MB, 2729 MB goal,
1 MB stacks, 0 MB globals, 16 P
How do we interpret this output?
- After the last GC cycle, the live heap (i.e., long-lived items) was around 1575MB. With our 100% growth goal, we would now exceed the 3GiB hard limit (2*1575 = 3150)
- The GC reports a goal slightly below the 3GiB hard limit; it reports 2729 MB. However, keep in mind that this is the last line that it was able to log before it was OOM-killed. Had it not been killed, we would have probably seen a value above 3000.
- As a side-note: The 1%, in the beginning, indicates that the GC spent about 1% of total CPU time. That is a good baseline to compare later on.
In summary, what happened?
- Our import failed; we could only import about 60% of our target load.
- The long-lived memory only made up around 1.5GiB, yet we received an OOM signal on a 3GiB machine.
- The explanation is that with
GOGC=100, the GC waits for the heap to double. That effectively means that on a 3GiB machine, we can never safely use more than 1.5GiB.
With GOMEMLIMIT=2750MiB
Now, I will repeat the same experiment. I will keep GOGC at 100, but will also introduce GOMEMLIMT. I have set the value slightly below the 3000MiB cgroup limit to 2750MiB. That is because GOMEMLIMIT is only a soft limit. It does not guarantee that the Go runtime will never exceed it; it just acts as a new target.
With the new parameter, I will invoke Weaviate like this:
docker run -it \
  -m 3GiB \
  -e "GOMEMLIMIT=2750MiB" \
  -e "GOGC=100" \
  -e "PERSISTENCE_DATA_PATH=/var/lib/weaviate" \
  -e "AUTHENTICATION_ANONYMOUS_ACCESS_ENABLED=true" \
  -e "PROMETHEUS_MONITORING_ENABLED=true" \
  -e "CLUSTER_HOSTNAME=node1" \
  -e "GODEBUG=gctrace=1" \
  -v "$PWD/data:/var/lib/weaviate" \
  -p "8080:8080" \
  -p "2112:2112" \
  weaviate
Now it's time to run the same experiment again… and, I have some good news! The import succeeded. Let's run a quick sanity check to prove that there are indeed 400,000 objects imported:
curl localhost:8080/v1/graphql \
  -H 'content-type: application/json' \
  -d '{"query":"{Aggregate{Example{meta{count}}}}"}'

{"data":{"Aggregate":{"Example":[{"meta":{"count":400000}}]}}}
As you can see, the imports are all present, let's take a look at the heap usage according to the Prometheus metrics:
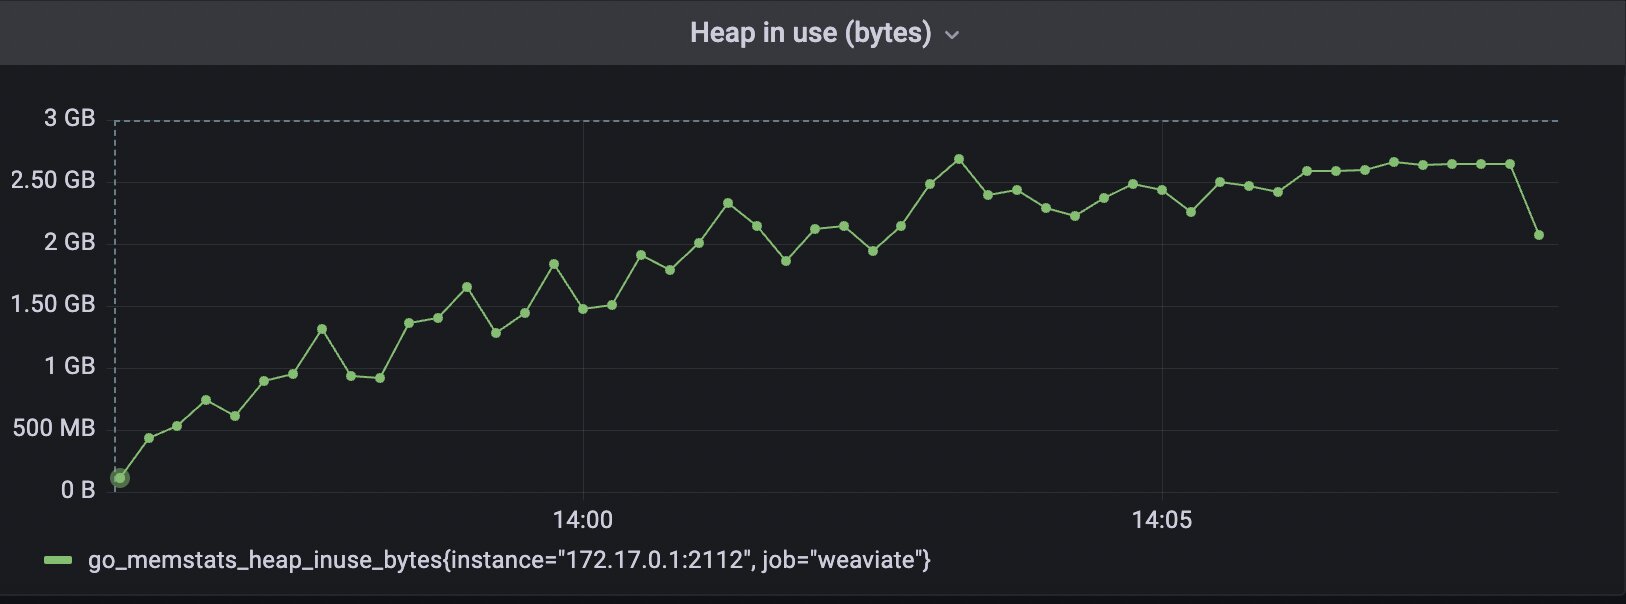
The chart shows exactly what we expected:
- At no time did the test exceed our hard 3GiB limit (hence no OOM kill)
- As it approached the limit the heap hovered around our configured 2750MiB GOMEMLIMIT
- After the import finished, the stable long-lived heap dropped to just above 2GiB
Let us also take a look at the most recent GC log:
gc 313 @692.771s 2%: 0.36+393+0.13 ms clock,
5.7+337/1572/1065+2.1 ms cpu,
2214->2272->2039 MB,
2296 MB goal, 0 MB stacks, 0 MB globals, 16 P
Again, this log output backs up our claims from above:
- After completing the import, the live heap is just over 2GiB (2039MB)
- As we got closer to our soft limit, the heap goal was no longer twice the live heap. Instead, it is barely above the live heap at 2296MB.
- The Go runtime has done a conscious trade-off to sacrifice a bit of CPU time to prevent us from running OOM. We can see that the self-reported cost of GC is now at 2%
In summary, how did GOMEMLIMIT save us from OOM?
- We could complete our full import without problems.
- The memory usage never exceeded our soft limit of 2.75GiB and, therefore, never our hard limit of 3GiB.
- GOMEMLIMIT made the GC more aggressive when less memory was available but kept it pretty relaxed when there was plenty.
Conclusion: GOMEMLIMIT is a game-changer!
We have covered quite a few points in this article, so let me summarize the key takeaways:
- Memory is either allocated on the stack (cheap) or the heap (expensive). Long-lived memory must live on the heap. Sometimes temporary memory "escapes" onto the heap.
- Before Go 1.19, the Go runtime could only set relative GC targets. That would make it very hard to use the available memory efficiently.
- With our experiments, we were able to prove that we could get our application to crash on a 3GiB machine when it barely used more than 1500MiB. We could only complete about 60% of our import scenario.
- After introducing
GOMEMLIMIT=2750MiB, our application no longer crashed and could efficiently use the available memory. The import succeeded.
Does that mean that GOMEMLIMIT is your get-out-of-jail-free card for heap allocations? No. A Go application that gets heavy usage still has to ensure allocation efficiency. Simply setting a GOMEMLIMIT will not make an inefficient application efficient. For an already well-optimized application such as Weaviate, GOMEMLIMIT can help you get the most out of your machines. It prevents unnecessary and annoying OOM kills.
Ready to start building?
Check out the Quickstart tutorial, and begin building amazing apps with the free trial of Weaviate Cloud Services (WCS).