
Enriching and Ingesting Data into Weaviate with Aryn
Much of today's data is in unstructured data formats that are difficult to process and extract information from. Large Language Models (LLMs) and natural-language search tools make it possible to build powerful search applications over unstructured data.
Real-world use-cases require more than just answering basic questions over text — they often need to answer complex questions over tables and figures. As more organizations build and deploy these types of applications, it will become increasingly clear that the quality of data is key to making them successful.
Vector embeddings work best when the text to embed is partitioned into semantically meaningful chunks. It’s often necessary to augment this data with additional metadata before embedding it to provide useful context for retrieval.
Aryn is an LLM-powered ETL system for complex, unstructured documents like PDFs, HTML, presentations, and more. It’s comprised of two components: the Aryn Partitioning Service and Sycamore.
The Aryn Partitioning Service (APS) is a serverless, GPU-powered API for segmenting and labeling PDF documents, doing OCR, extracting tables and images, and more. It turns your messy documents into beautiful, structured JSON. APS runs the Aryn Partitioner and it’s state-of-the-art, open source deep learning DETR AI model trained on 80k+ enterprise documents. This can lead to 6x more accurate data chunking and 2x improved recall on hybrid search or RAG when compared to off-the-shelf systems.
Next, you can use Sycamore, Aryn’s Apache-v2-licensed open-source document processing engine, for data enrichment, transforms, cleaning, and loading vector databases like Weaviate. Sycamore combines a robust model handling large collections unstructured documents with a rich set of composable LLM-powered transforms for cleaning, filtering, and enriching those documents. Sycamore runs on a reliable dataflow engine that can scale from a laptop to a large cluster.
Getting Started
In this post, we will show how to use the open-source Sycamore library and Aryn Partitioning Service to load PDFs into Weaviate. We will use two academic papers as our dataset. You learn how to:
- Read and partition these documents
- Use Sycamore to augment each document with additional metadata
- Load the documents into Weaviate
You can find the demo in Weaviate Recipes.
Sycamore DocSets
One the of the main design goals of Sycamore is to make it easy for programmers to write complex transformations over large collections of data in a robust and concise way. To accomplish this, Sycamore borrows ideas from dataflow systems like Apache Spark. The core abstraction in Sycamore is a data structure called the DocSet. Think of a DocSet like a Spark DataFrame, except purpose-built to represent unstructured documents.
Each DocSet represents a collection of unstructured documents. Sycamore automatically parallelizes DocSets, and they can be used to process collections ranging from a single document to many thousands. Each document in Sycamore contains an arbitrary set of key-value properties, as well as an ordered list of elements. An element corresponds to a chunk of the document that can be processed or embedded separately. A chunk can represent an image, a table, or a text passage, to give a few examples. Like documents, elements can contain arbitrary key-value properties to encode domain or application specific metadata.
Creating a DocSet is simple. We first initialize the Sycamore context, and use that to read a collection of documents. In this case we are reading from an S3 bucket, but you can also read from a local filesystem or another vector store. Throughout this blog post we will use ds.show() to display the contents of a DocSet after each transform, though in a real Sycamore job without the show calls, operations would be pipelined for better performance.
import sycamore

paths = ["../data/"]

context = sycamore.init()
ds = context.read.binary(paths=paths, binary_format="pdf")

ds.show()
Output
 {'properties': {'path': '/data/weaviate_blog_data/paper01.pdf',
                'filetype': 'application/pdf'},
 'elements': [],
 'lineage_id': 'f83129f1-a262-42b2-83ca-93eab55e681c',
 'doc_id': 'cdac2186-3508-11ef-8457-beb9cd7f789b',
 'type': 'pdf',
 'binary_representation': b'<4276196 bytes>'}
{'properties': {'path': '/data//weaviate_blog_data/paper02.pdf',
                'filetype': 'application/pdf'},
 'elements': [],
 'lineage_id': '0833a5a3-9369-40e0-a966-2b107f24d512',
 'doc_id': 'd0301214-3508-11ef-aeb4-beb9cd7f789b',
 'type': 'pdf',
 'binary_representation': b'<99004 bytes>'}
In the output you can find entries for both documents, each of which contains some IDs, a few default metadata fields, and the complete binary content of the PDF. Each document also contains a list of elements corresponding to the constituent components of that document. In this case, the lists are empty because we haven’t yet started processing the PDFs, but by the end of this job they will contain the chunks we embed and load into Weaviate.
Chunking Documents with the Aryn Partitioning Service
The first step in preparing our documents for ingestion into Weaviate is to partition them into elements that we can process separately. This involves identifying entities in a document like images or tables, as well as classifying text in categories like header, caption, and so forth. Once we understand the structure of the document, we can start to perform more specialized transforms on different elements.
Since PDF is intended as a display format, it can be difficult to automatically extract this partitioning from the file format itself. An alternative approach is to treat the PDF as an image and use a vision model to identify and label different segments of the document. To support partitioning in Sycamore, Aryn trained a state-of-the-art vision model on more than 80,000 document pages from the DocLayNet dataset. This model is fully open-source with an Apache 2.0 license and is available for download on HuggingFace.
The easiest way to use the Aryn Partitioner in Sycamore is via the Aryn Partitioning Service, which provides a REST endpoint for partitioning PDFs. You can sign up for this service at https://www.aryn.ai/get-started. You invoke this using the partition transform on a DocSet and specify the ArynPartitioner. In this case we specify two flags: extract_table_structure and extract_images, which identify table cells and images, respectively:
from sycamore.transforms import ArynPartitioner

# Make sure your Aryn token is accessible in
# the environment variable ARYN_API_KEY

ds.partition(partitioner=ArynPartitioner(
	extract_table_structure=True, extract_images=True))

ds.show()
If you prefer not to use an external service, you can pass the parameter use_partitioning_service=False. Note that that the partitioning model can be computationally expensive, and works best with an NVIDIA GPU.
This output is truncated for brevity
Output
 {'properties': {'path': '/data/weaviate_blog_data/paper02.pdf',
                'filetype': 'application/pdf'},
 'elements': [{'type': 'Title',
               'bbox': (0.10576679902918198,
                        0.12537189830433237,
                        0.8944931209788602,
                        0.16057667125355113),
               'properties': {'score': 0.7206793427467346, 'page_number': 1},
               'text_representation': 'A Comparison of House Price '
                                      'Classification with Structured and '
                                      'Unstructured\n'
                                      'Text Data\n'},
              {'type': 'Text',
               'bbox': (0.304765625,
                        0.18768619884144175,
                        0.48276751349954045,
                        0.22780573064630683),
               'properties': {'score': 0.7071972489356995, 'page_number': 1},
               'text_representation': 'Connor Shorten\n'
                                      'Florida Atlantic University\n'
                                      'cshorten2015@fau.edu\n'},
              {'type': 'Text',
               'bbox': (0.09357208251953125,
                        0.19220895940607244,
                        0.27119919720818014,
                        0.22658688631924717),
               'properties': {'score': 0.5217146873474121, 'page_number': 1},
               'text_representation': 'Erika Cardenas\n'
                                      'Florida Atlantic University\n'
                                      'ecardenas2015@fau.edu\n'},
              {'type': 'Section-header',
               'bbox': (0.2535585111730239,
                        0.2769498235529119,
                        0.3145053998161765,
                        0.2873718816583807),
               'properties': {'score': 0.8558671474456787, 'page_number': 1},
               'text_representation': 'Abstract\n'},
              {'type': 'Text',
               'bbox': (0.12054235121783088,
                        0.3003679865056818,
                        0.44732683967141545,
                        0.574689608487216),
               'properties': {'score': 0.9367411732673645, 'page_number': 1},
               'text_representation': 'Purchasing a home is one of the largest '
                                      'investments\n'
                                      'most people make. House price '
                                      'prediction allows  <1075 chars>'},
								...]
  }
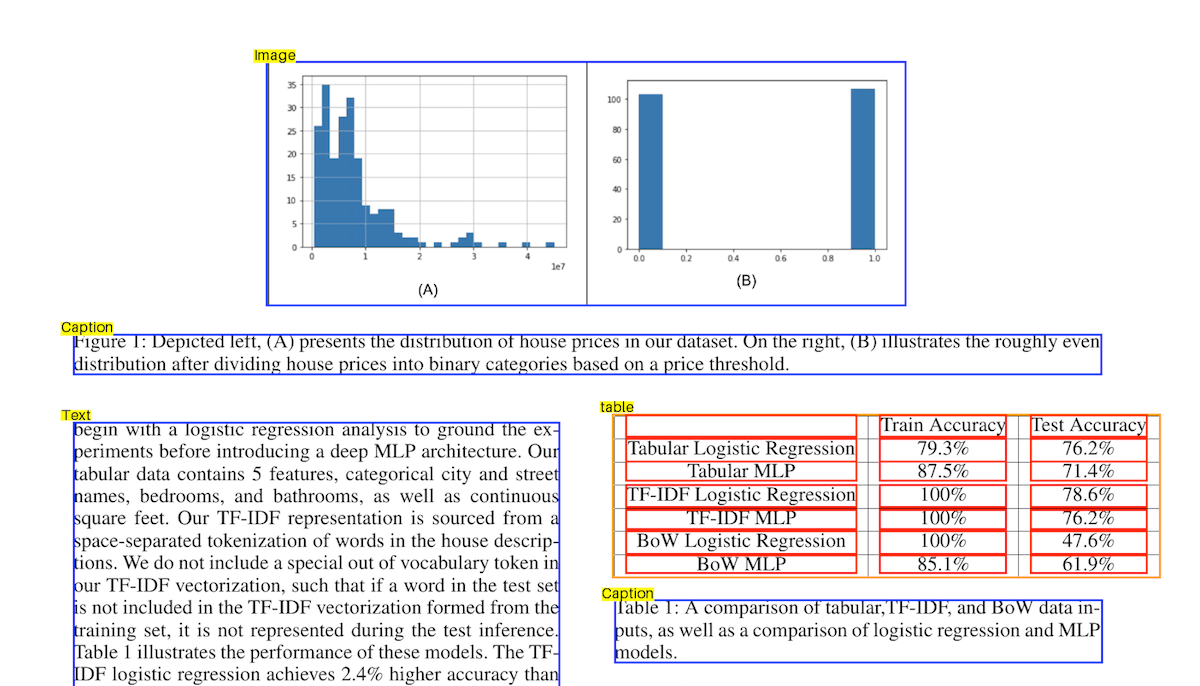
Each document in the DocSet now contains a list of elements that make up the document, including bounding boxes and text content. The following is a sample of a document after partitioning. Note that the table and figure are correctly identified, as are the individual cells in the table.
Sycamore Transforms: Entity Extraction and Summarization
In addition to partitioning data, using DocSets makes it easy to augment and transform your unstructured datasets. For example, you might want to extract structured pieces of information from documents and include them as properties that you can later query from Weaviate. For example, in our academic papers, we might want to pull out the title, authors, and abstract. There are lots of ways we might try to extract this information, but it can be surprisingly tricky in general. Different publications have different formats, and writing a set of rules to cover all of them is difficult if not impossible.
Instead, let’s embrace the new AI-powered world and ask an LLM. With Sycamore, you can use the extract_properties transform to pull out fields based on a JSON schema. Sycamore will send a prefix of each document to an LLM, in this case GPT-4o, to extract the specified fields and include them as properties in the document.
The following shows the sample code:
from sycamore.llms import OpenAI, OpenAIModels
from sycamore.transforms.extract_schema import OpenAIPropertyExtractor

# Specifies a schema name and type that direct the LLM what properties to extract.
schema_name = "PaperInfo"
schema = {
	"title": "string",
	"authors": "list[string]",
	"abstract": "string"
}

openai = OpenAI(OpenAIModels.GPT_4O) # Reads the OPENAI_API_KEY env var

# Extract the properties and add them under a special key "entity" in the
# document properties. By default this sends the first 10 elements of the
# of the Document the LLM.
ds = ds.extract_properties(OpenAIPropertyExtractor(
   llm=openai,
   schema_name=schema_name,
   schema=schema))

ds.show(show_elements=False)
This displays the following dictionary for our two sample documents. The title, authors, and abstract are included as properties:
Output
{'properties': {'path': '/data/weaviate_blog_data/paper02.pdf',
                'filetype': 'application/pdf',
                'entity': {'title': 'A Comparison of House Price '
                                    'Classification with Structured and '
                                    'Unstructured Text Data',
                           'authors': ['Connor Shorten',
                                       'Erika Cardenas',
                                       'Taghi M. Khoshgoftaar',
                                       'Borivoje Furht'],
                           'abstract': 'Purchasing a home is one of the '
                                       'largest investments most people make. '
                                       'House price prediction allows '
                                       'individuals to be informed about their '
                                       'asset wealth. Transparent pricing on '
                                       'homes allows for a more efficient '
                                       'market and economy. We report the '
                                       'performance of machine learning models '
                                       'trained with structured tabular '
                                       'representations and unstructured text '
                                       'descriptions. We collected a dataset '
                                       'of 200 descriptions of houses which '
                                       'include meta-information, as well as '
                                       'text descriptions. We test logistic '
                                       'regression and multi-layer perceptron '
                                       '(MLP) classifiers on dividing these '
                                       'houses into binary buckets based on '
                                       'fixed price thresholds. We present an '
                                       'exploration into strategies to '
                                       'represent unstructured text '
                                       'descriptions of houses as inputs for '
                                       'machine learning models. This includes '
                                       'a comparison of term frequency-inverse '
                                       'document frequency (TF-IDF), '
                                       'bag-of-words (BoW), and zero-shot '
                                       'inference with large language models. '
                                       'We find the best predictive '
                                       'performance with TF-IDF '
                                       'representations of house descriptions. '
                                       'Readers will gain an understanding of '
                                       'how to use machine learning models '
                                       'optimized with structured and '
                                       'unstructured text data to predict '
                                       'house prices.'}},
 'elements': '<71 elements>',
 'lineage_id': '85e25311-da00-42a3-aed1-dbad7ade0f1d',
 'doc_id': 'b5402222-2f64-11ef-a8fb-beb9cd7f789b',
 'type': 'pdf',
 'binary_representation': b'<99004 bytes>'}
{'properties': {'path': '/data/weaviate_blog_data/paper01.pdf',
                'filetype': 'application/pdf',
                'entity': {'title': 'A survey on Image Data Augmentation for '
                                    'Deep Learning',
                           'authors': ['Shorten', 'Taghi M. Khoshgoftaar'],
                           'abstract': 'Deep convolutional neural networks '
                                       'have performed remarkably well on many '
                                       'Computer Vision tasks. However, these '
                                       'networks are heavily reliant on big '
                                       'data to avoid overfitting. Overfitting '
                                       'refers to the phenomenon when a '
                                       'network learns a function with very '
                                       'high variance such as to perfectly '
                                       'model the training data. '
                                       'Unfortunately, many application '
                                       'domains do not have access to big '
                                       'data, such as medical image analysis. '
                                       'This survey focuses on Data '
                                       'Augmentation, a data-space solution to '
                                       'the problem of limited data. Data '
                                       'Augmentation encompasses a suite of '
                                       'techniques that enhance the size and '
                                       'quality of training datasets such that '
                                       'better Deep Learning models can be '
                                       'built using them. The image '
                                       'augmentation algorithms discussed in '
                                       'this survey include geometric '
                                       'transformations, color space '
                                       'augmentations, kernel filters, mixing '
                                       'images, random erasing, feature space '
                                       'augmentation, adversarial training, '
                                       'generative adversarial networks, '
                                       'neural style transfer, and '
                                       'meta-learning. The application of '
                                       'augmentation methods based on GANs are '
                                       'heavily covered in this survey. In '
                                       'addition to augmentation techniques, '
                                       'this paper will briefly discuss other '
                                       'characteristics of Data Augmentation '
                                       'such as test-time augmentation, '
                                       'resolution impact, final dataset size, '
                                       'and curriculum learning. This survey '
                                       'will present existing methods for Data '
                                       'Augmentation, promising developments, '
                                       'and meta-level decisions for '
                                       'implementing Data Augmentation. '
                                       'Readers will understand how Data '
                                       'Augmentation can improve the '
                                       'performance of their models and expand '
                                       'limited datasets to take advantage of '
                                       'the capabilities of big data.'}},
 'elements': '<106 elements>',
 'lineage_id': 'a62f4ca2-8863-4e19-8373-7a338ce2f753',
 'doc_id': 'b4fbd4c8-2f64-11ef-acb6-beb9cd7f789b',
 'type': 'pdf',
 'binary_representation': b'<1634173 bytes>'}
PDF documents also frequently contain images. The rise of multi-modal LLMs now make it possible to answer questions over images as well as text. Let’s use Sycamore to summarize the contents of each image in the documents into a form that we can easily embed. This requires only one line of code to invoke the SummarizeImages transform. This will send all of the images in both documents to an LLM to compute a text summary and add it to the appropriate element in the DocSet.
from sycamore.transforms.summarize_images import OpenAIImageSummarizer, SummarizeImages

ds = ds.transform(SummarizeImages)

# Display only the image elements from each document.
ds.filter_elements(lambda e: e.type == 'Image')\
  .show()
The following output is a truncated version of the output containing the summaries for Figures 1 and 2 in the first paper and Figure 1 in the second.
Output
{'properties': {'path': '/data/weaviate_blog_data/paper02.pdf',
'filetype': 'application/pdf'},
'elements': [{'type': 'Image',
'bbox': (0.24269660500919119,
0.0672540976784446,
0.7563384650735294,
0.218844687721946),
'properties': {'score': 0.7568760514259338,
'image_size': (893, 353),
'image_mode': 'RGB',
'image_format': None,
'page_number': 3,
'summary': {'is_graph': True,
'x-axis': 'House Prices (A: in units '
'of 1e7, B: Binary '
'Categories)',
'y-axis': 'Frequency',
'summary': 'The left graph (A) shows '
'the distribution of '
'house prices in the '
'dataset, with most '
'prices concentrated '
'below 1e7 units. The '
'frequency of house '
'prices decreases as the '
'price increases. The '
'right graph (B) shows '
'the distribution of '
'house prices divided '
'into binary categories '
'based on a price '
'threshold, with both '
'categories having '
'roughly equal '
'frequencies. This '
'indicates a balanced '
'distribution of house '
'prices when categorized '
'into two groups.'}},
'binary_representation': b'<945687 bytes>',
'text_representation': 'The left graph (A) shows the '
'distribution of house prices in the '
'dataset, with most prices concentra '
'<346 chars>'}],
'lineage_id': '425c2c60-e03b-42dc-b96e-2b1436996136',
'doc_id': '4ee6bfde-33fd-11ef-8035-beb9cd7f789b',
'type': 'pdf',
'binary_representation': b'<99004 bytes>'}
{'properties': {'path': '/data/weaviate_blog_data/paper01.pdf',
'filetype': 'application/pdf'},
'elements': [{'type': 'Image',
'bbox': (0.19754511730558494,
0.11118162117820465,
0.8048013043663089,
0.3012842830333267),
'properties': {'score': 0.7079999446868896,
'image_size': (1024, 438),
'image_mode': 'RGB',
'image_format': None,
'page_number': 2,
'summary': {'is_graph': True,
'x-axis': 'Epoch',
'y-axis': 'Classification Accuracy',
'summary': 'The left graph shows '
'signs of overfitting, '
'where the training error '
'decreases continuously '
'while the testing error '
'starts to increase after '
'a certain point, '
'indicating that the '
'model performs well on '
'training data but poorly '
'on testing data. The '
'right graph shows the '
'desired convergence of '
'training and testing '
'error, where both errors '
'decrease and converge '
'over time, indicating '
'good generalization of '
'the model. Both graphs '
'plot Classification '
'Accuracy against Epochs, '
'with the training error '
'in blue and the testing '
'error in red. The x-axis '
'represents the number of '
'epochs, and the y-axis '
'represents the '
'classification '
'accuracy.'}},
'text_representation': 'The left graph shows signs of '
'overfitting, where the training error '
'decreases continuously while the <532 '
'chars>',
'binary_representation': b'<1345536 bytes>'},
{'type': 'Image',
'bbox': (0.19848457530158894,
0.11063410360052416,
0.8046731083972567,
0.49440371235989417),
'properties': {'score': 0.8436420559883118,
'image_size': (1023, 863),
'image_mode': 'RGB',
'image_format': None,
'page_number': 4,
'summary': {'is_graph': False,
'summary': 'The image is a taxonomy '
'diagram of image data '
'augmentations. It '
'categorizes various '
'augmentation techniques '
'into two main groups: '
'Basic Image '
'Manipulations and Deep '
'Learning Approaches. '
'Basic Image '
'Manipulations include '
'Kernel Filters, Color '
'Space Transformations, '
'Geometric '
'Transformations, Random '
'Erasing, and Mixing '
'Images. Deep Learning '
'Approaches include '
'Adversarial Training, '
'Neural Style Transfer, '
'and GAN Data '
'Augmentation. The '
'diagram also shows how '
'these techniques relate '
'to Meta Learning, which '
'further branches into '
'Neural Augmentation, '
'AutoAugment, and Smart '
'Augmentation.'}},
'text_representation': 'The image is a taxonomy diagram of '
'image data augmentations. It '
'categorizes various augmentation tec '
'<486 chars>',
'binary_representation': b'<2648547 bytes>'}],
'lineage_id': '7f428761-29c6-4e6b-9c61-b5abcbdeb0b6',
'doc_id': '4e9d81b6-33fd-11ef-a939-beb9cd7f789b',
'type': 'pdf',
'binary_representation': b'<1634173 bytes>'}
The summaries contain a text description of the image, as well as metadata about whether or not the images is a graph, and if so, what the axes are. The prompt used to extract this information is customizable to support additional use cases.
Note that Sycamore leverages the structural information from the partition transform to improve the quality of the summary. For instance, for the following figure, the image contains only the bar chart, which does not have any axes. Sycamore recognizes that the caption is associated with the image and sends it to the LLM to aid with summarization. Because of this, the summary accurately indicates that the graphs show a distribution of house prices.
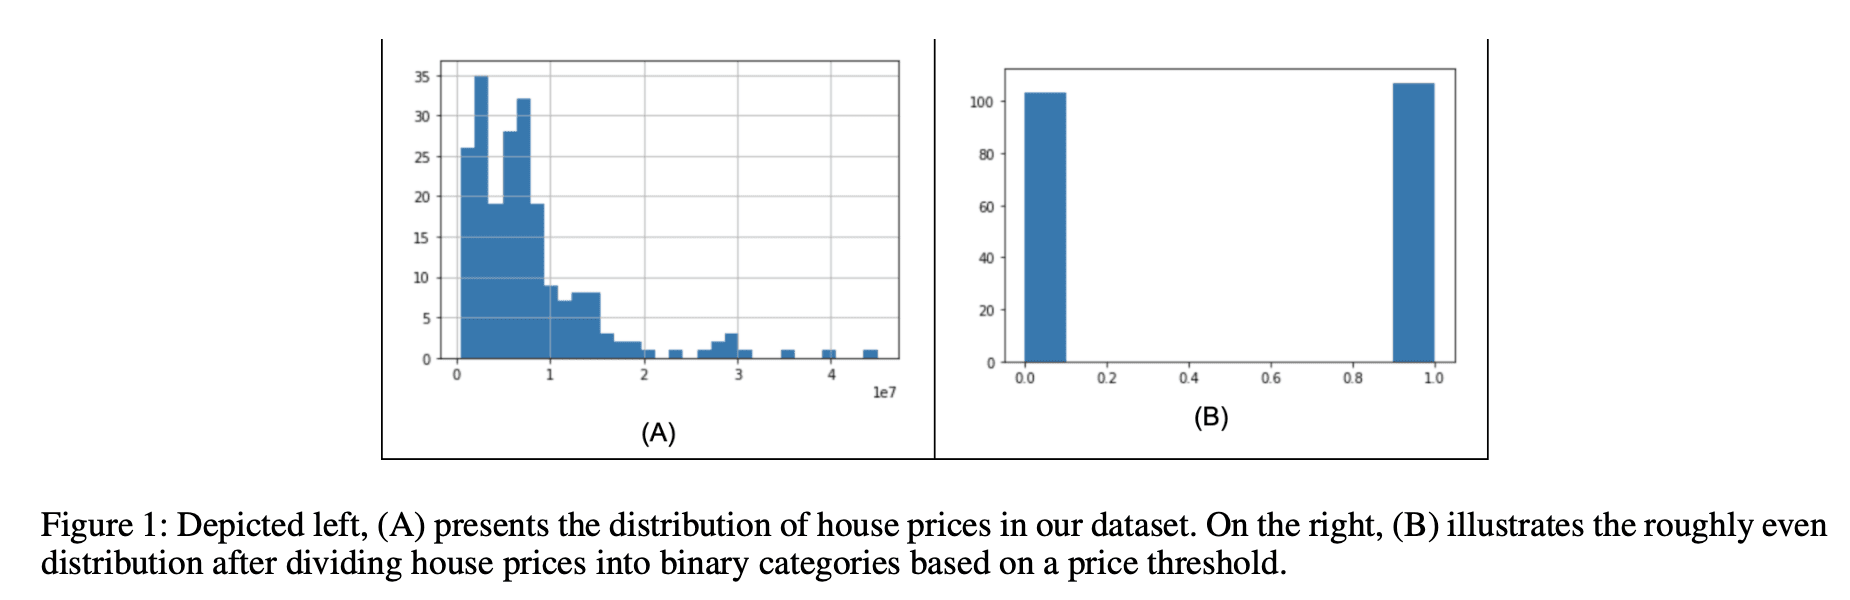
Summary:
The left graph (A) shows the distribution of house prices in the dataset, with most prices concentrated below 1e7 units. The frequency of house prices decreases as the price increases. The right graph (B) shows the distribution of house prices divided into binary categories based on a price threshold, with both categories having roughly equal frequencies. This indicates a balanced distribution of house prices when categorized into two groups.
An End-to-End Example
Now that we have seen how to work with DocSets. Let's see how to integrate with Weaviate to build an end-to-end application.
Writing to Weaviate
The final step in the ingestion pipeline is to compute embeddings and write the DocSet to Weaviate. The following code sets up the configuration for the Weaviate client and the collection to which to write:
from weaviate.client import AdditionalConfig, ConnectionParams
from weaviate.config import Timeout
from weaviate.collections.classes.config import Configure
from weaviate.classes.config import ReferenceProperty

collection = "WeaviateSycamoreDemoCollection"
wv_client_args = {
    "connection_params": ConnectionParams.from_params(
        http_host="localhost",
        http_port=8080,
        http_secure=False,
        grpc_host="localhost",
        grpc_port=50051,
        grpc_secure=False,
    ),
    "additional_config": AdditionalConfig(timeout=Timeout(init=2, query=45, insert=300)),
}
collection_config_params = {
    "name": collection,
    "description": "A collection to demo data-prep with Sycamore",

    # Sycamore can be used to embed document chunks before writing to Weaviate, so this is primarily to
    # ensure that queries are embedded using the correct model in Weaviate. If you don't need to embed
    # queries or can do so externally, you can change the vectorizer_config to None.
    "vectorizer_config": [Configure.NamedVectors.text2vec_transformers(name="embedding", source_properties=['text_representation'])],
}
With this configuration out of the way, the Sycamore code to embed and write the DocSet is quite compact:
from sycamore.transforms.embed import SentenceTransformerEmbedder

model_name = "sentence-transformers/all-MiniLM-L6-v2"

ds.spread_properties(["path", "entity"])
  .explode()
  .embed(embedder=SentenceTransformerEmbedder(
      model_name=model_name, batch_size=1000))
  .write.weaviate(
      wv_client_args=wv_client_args,
      collection_name=collection,
      collection_config=collection_config_params,
      flatten_properties=True)
This does a few things:
- The
spread_propertiestransform adds the specified document-level properties to each element in the document. This makes it easier to filter specific chunks by the properties, like title and author, that we extracted previously. - The next transform,
explode, unnests each document by converting each element into a top-level document. This means our DocSet is now a collection of the chunks that we will load into Weaviate. - The
embedtransform computes the vector embedding for each chunk. By default, Sycamore will embed thetext_representionfield of each chunk in the DocSet using the specified embedder. Here we use theall-MiniLM-L6-v2sentence-transformer model, which is a small model that works well for tests and demos. Sycamore supports a range of embedding models, including remote models from OpenAI and others. It is also possible to let Weaviate do the embeddings by omitting this step and adjusting the collection configuration. - Finally, we perform the
writeto Weaviate. You will notice here that we set theflatten_propertiesattribute toTrue. This addresses the fact that Sycamore properties can be nested, but Weaviate currently only allows filtering by top-level attributes. Flattened column names are separated by__characters. For example, if you have the property{"properties": {"authors": []}}, it will be stored with the keyproperties__authorsin Weaviate. Supporting nested objects is on Weaviate's radar. Please upvote this issue to help the team prioritize.
You can find more information about Sycamore transformations in the Sycamore documentation.
Putting it all together
Combining all of these steps and removing the calls to show, we get the following script:
import sycamore
from sycamore.llms import OpenAI, OpenAIModels
from sycamore.transforms.partition import SycamorePartitioner
from sycamore.transforms.extract_schema import OpenAIPropertyExtractor
from sycamore.transforms.summarize_images import SummarizeImages
from sycamore.transforms.embed import SentenceTransformerEmbedder
from weaviate.client import AdditionalConfig, ConnectionParams
from weaviate.config import Timeout
from weaviate.collections.classes.config import Configure

# Model and property extraction configuration
llm = OpenAI(OpenAIModels.GPT_4O)
schema_name = "PaperInfo"
schema = {
    "title": "string",
    "authors": "list[string]",
    "abstract": "string"
}

# Weaviate configuration.
collection = "WeaviateSycamoreDemoCollection"
wv_client_args = {
    "connection_params": ConnectionParams.from_params(
        http_host="localhost",
        http_port=8080,
        http_secure=False,
        grpc_host="localhost",
        grpc_port=50051,
        grpc_secure=False,
    ),
    "additional_config": AdditionalConfig(timeout=Timeout(init=2, query=45, insert=300)),
}
collection_config_params = {
    "name": collection,
    "description": "A collection to demo data-prep with Sycamore",
    "vectorizer_config": [Configure.NamedVectors.text2vec_transformers(name="embedding", source_properties=['text_representation'])],
}
model_name = "sentence-transformers/all-MiniLM-L6-v2"

paths = ["s3://aryn-public/weaviate_blog_data/"]

# Sycamore script to ingest data into Weaviate.
context = sycamore.init()
context.read.binary(paths=paths, binary_format="pdf")\
            .partition(partitioner=SycamorePartitioner(
                extract_table_structure=True, extract_images=True))\
            .extract_properties(OpenAIPropertyExtractor(
                llm=llm,
                schema_name=schema_name,
                schema=schema))\
            .transform(SummarizeImages)\
            .spread_properties(["path", "entity"])\
            .explode()\
            .embed(embedder=SentenceTransformerEmbedder(
                model_name=model_name, batch_size=1000))\
            .write.weaviate(
                wv_client_args=wv_client_args,
                collection_name=collection,
                collection_config=collection_config_params,
                flatten_properties=True)
As with any Sycamore script, this script can be run on a few documents on a laptop or scale to a cluster to process a large set of documents without changing the code. You can learn more about Sycamore's approach to scalability here.
Reading from Weaviate
Once the data is loaded into Weaviate, you can query it using standard Weaviate search operations, leveraging both the text embeddings and properties. For example, if I’m interested in images about skin cancer classification, then I could do the following query, which combines a hybrid search over the embedded text representation with a filter for only Image elements.
import weaviate
from weaviate.classes.query import Filter

# Utility method for formatting the output in an easily readable way.
def print_search_result(sr):
    for obj in sr.objects:
        print("=" * 80)
        for p in obj.properties:
            print(f"{p: <30}| {obj.properties[p]}")

# Specify the properties to return in the vector search.
get_props = [
	"text_representation",
	"type",
	"properties__path",
	"properties__page_number",
	"properties__entity__authors",
	"properties__entity__title"
]

# Do a hybrid search query with a filter for Image elements.
print_search_result(demo.query.hybrid(
    query="Applications of deep learning to skin cancer image classification.",
    query_properties=["text_representation"],
    target_vector="embedding",
    return_properties=get_props,
    filters=Filter.by_property("type").equal("Image"),
    limit=2
))
Note that the output contains the summary of the image we extracted using the SummarizeImages transform.
Results
================================================================================
type                          | Image
properties__page_number       | 37.0
properties__path              | /data/weaviate_blog_data/paper01.pdf
text_representation           | The graph shows the impact of test-time data augmentation on skin lesion classification across three different models: Inception-v4, ResNet-152, and DenseNet-161. The x-axis represents the dataset length, while the y-axis represents the AUC (Area Under the Curve) values. Three conditions are compared: no augmentation, augmentation during training, and augmentation during both training and testing. The results indicate that augmentation during both training and testing generally yields the highest AUC values across all models and dataset lengths. The performance improves as the dataset length increases.
properties__entity__title     | A survey on Image Data Augmentation for Deep Learning
properties__entity__authors   | ['Connor Shorten', 'Taghi M. Khoshgoftaar']
================================================================================
properties__page_number       | 9.0
type                          | Image
properties__path              | /data/weaviate_blog_data/paper01.pdf
properties__entity__title     | A survey on Image Data Augmentation for Deep Learning
text_representation           | The image shows examples of color augmentations applied to melanoma images. The augmentations include Contrast +20%, Histogram Equalization, White Balance, and Sharpen. Each augmentation is applied to the same base image to demonstrate the visual differences. These augmentations are used in the domain of melanoma classification to potentially improve the performance of image analysis algorithms.
properties__entity__authors   | ['Connor Shorten', 'Taghi M. Khoshgoftaar']
Conclusions
In this post, you saw how to use Sycamore with the Aryn Partitioning Service to partition, transform, and load complex PDFs into Weaviate. You saw how the Aryn Partitioner can be used to accurately partition complex PDFs in order to identify components like images and tables. And, you saw that Sycamore DocSets give you a compact and expressive way to augment, transform, and embed these documents and load them into Weaviate. While we used a small example with two documents, Sycamore is designed to be scalable and can utilize multiple cores, GPUs, and machines to run over very large collections of documents.
You can find out more about Sycamore at on GitHub and more about the Aryn Partitioning Service here.
An extended version of this post is avaialble on Weaviate Recipes.
Ready to start building?
Check out the Quickstart tutorial, or build amazing apps with a free trial of Weaviate Cloud (WCD).
Don't want to miss another blog post?
Sign up for our bi-weekly newsletter to stay updated!
By submitting, I agree to the Terms of Service and Privacy Policy.