
Monitoring Weaviate in Production
Weaviate is designed to be easy to monitor and observe by following a cloud native approach. To do this Weaviate supports the following features
-
Publishing of Prometheus metrics to the standard
/metricsendpoint -
Use of built-in Kubernetes liveness and readiness checks
-
Configuration of settings via environment variables
-
Simplified deployment via helm charts
There is existing documentation on the exported metrics which also has an example for how to use a Prometheus instance for metrics.
One common question though is: How can I integrate Weaviate with my existing observability stack?
This article describes two approaches using either Grafana agent or Datadog agent to scrape these metrics. It also provides a list of important metrics to monitor.
Prerequisites
It is assumed that you have already deployed Weaviate. By default Prometheus monitoring is disabled, so you can enable it with this environment setting:
PROMETHEUS_MONITORING_ENABLED=true
Weaviate will then publish Prometheus metrics on port 2112.
If you are using Weaviate 1.17 or lower, you may want to upgrade to 1.18 before enabling Prometheus metrics. The reason being Weaviate previously published many histograms which has since been replaced by summaries for performance reasons. Additionally, be careful enabling Prometheus metrics if you have many thousands of classes as you may end up with high cardinality labels due to some metrics being produced per class.
Grafana Agent


For the first approach we will use the open-source Grafana agent. In this case, we will show writing to Grafana Cloud for hosted metrics. This is configurable via the remote write section if you alternatively want to write to a self-hosted Mimir or Prometheus instance.
Steps to Install
1. Install Grafana agent in your target environment following the set-up guide.
2. Configure the Grafana agent.yaml to include a scrape job called weaviate. This will autodiscover Weaviate pods
in Kubernetes. The app=weaviate label is automatically added by the Weaviate helm chart which makes autodiscovery easy.
metrics:
    configs:
    - name: weaviate
    # reference https://prometheus.io/docs/prometheus/latest/configuration/configuration/#scrape_config
    scrape_configs:
    - job_name: weaviate
        scrape_interval: 30s
        scheme: http
        metrics_path: /metrics
        kubernetes_sd_configs:
        - role: pod
        selectors:
        - role: "pod"
            label: "app=weaviate"
    remote_write:
    - url: <Your Grafana.com prometheus push url>
        basic_auth:
        username: <Your Grafana.com userid>
        password: <Your Grafana.com API Key>
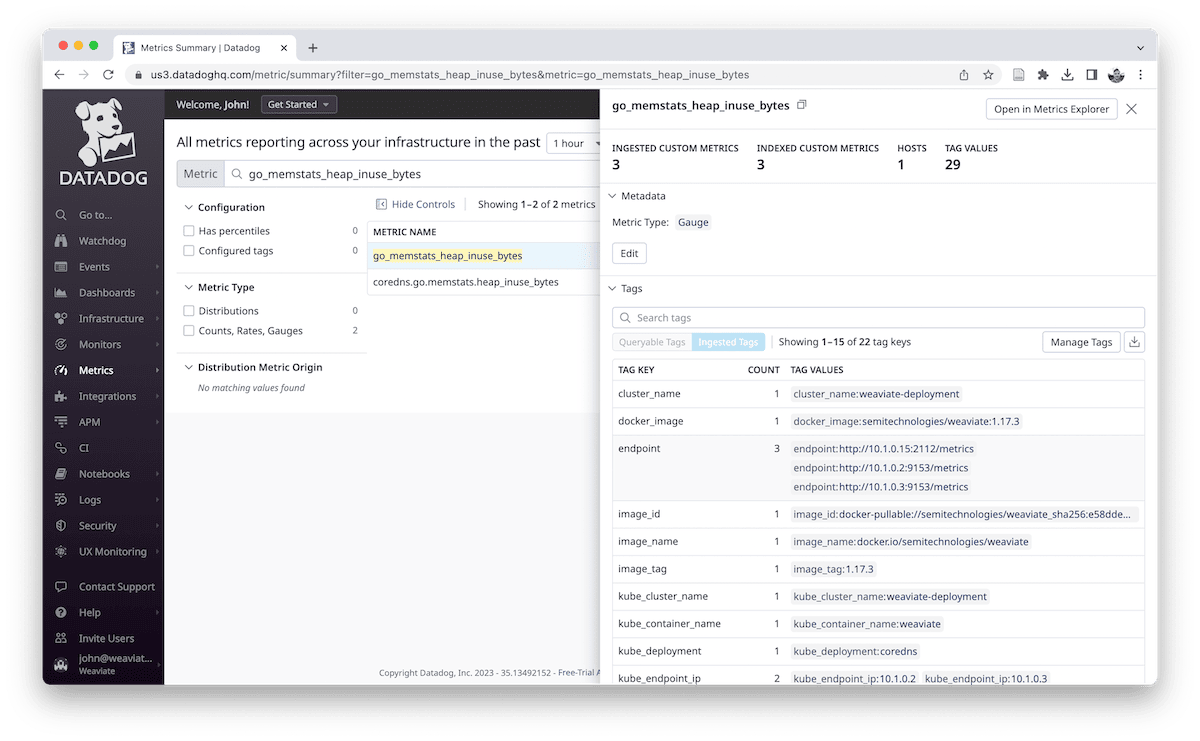
3. Validate that you are receiving data by going to explore and running the following PromQL query in Grafana.
go_memstats_heap_inuse_bytes{job="weaviate"}
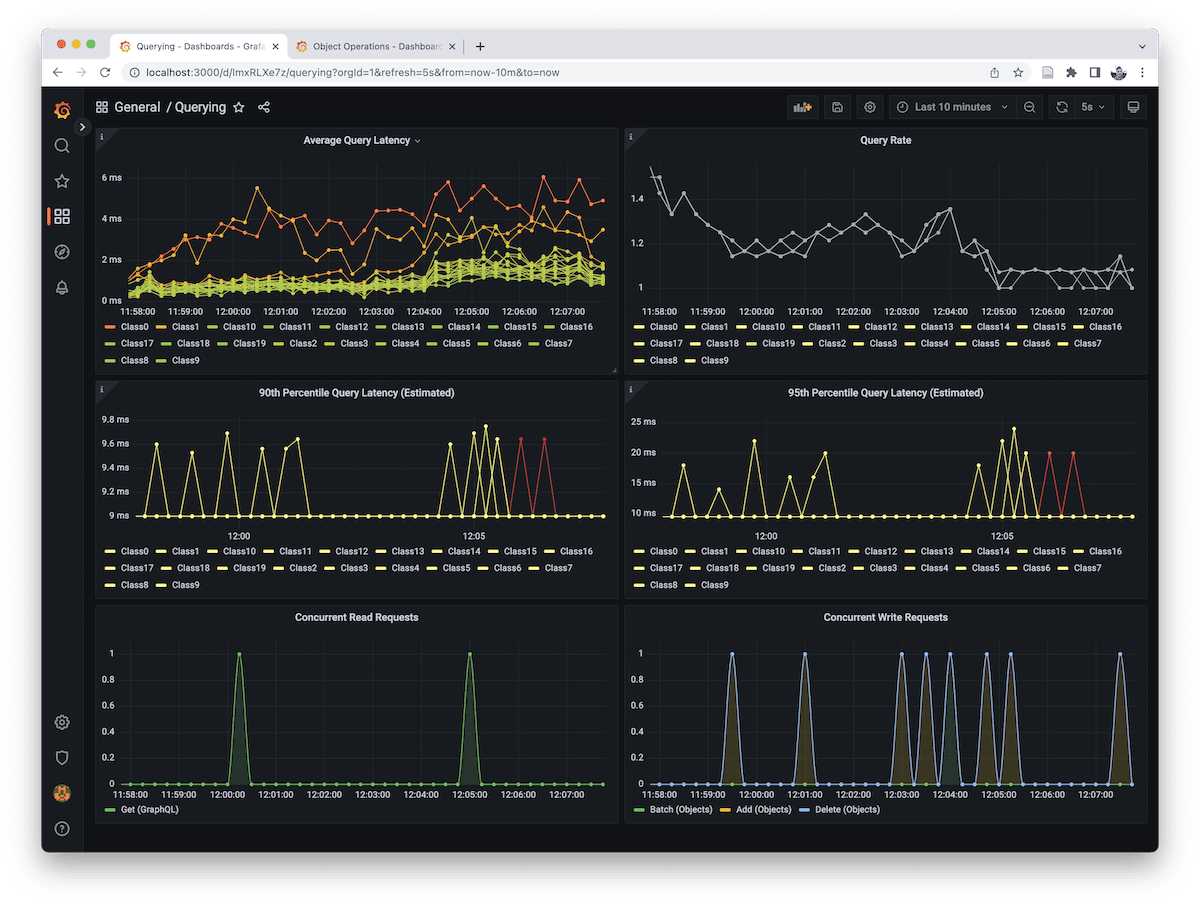
Dashboards
One benefit of this approach is that you can now reuse the existing Weaviate Grafana dashboards.
Steps to import these dashboards:
1. Download and import the preexisting dashboards.
2. If you're using Grafana Cloud hosted Prometheus you will need to patch the dashboards to change the datasource uid to be grafanacloud-prom as below.
sed 's/"uid": "Prometheus"/"uid": "grafanacloud-prom"/g' querying.json > querying-patched.json
The dashboards should now be visible!
Datadog
Datadog is another popular solution for observability, and the Datadog agent has support for scraping Prometheus metrics.
Steps to Install
1. Install the datadog agent. For this example, installation was done using their Helm charts.
2. Provide a datadog-values.yml config including the below. You can also capture Weaviate logs using the method.
datadog:
# Note DD_KUBELET_TLS_VERIFY only needs to be set if running a local docker kubernetes cluster
#  env:
#  - name: DD_KUBELET_TLS_VERIFY
#    value: "false"
  clusterName: weaviate-deployment
  prometheusScrape:
    enabled: true
    serviceEndpoints: true
    additionalConfigs:
      - configurations:
        - max_returned_metrics: 20000
          min_collection_interval: 30
3. Customize the Weaviate helm chart to have annotations prometheus.io/scrape and prometheus.io/port
# Pass any annotations to Weaviate pods
annotations:
  prometheus.io/scrape: "true"
  prometheus.io/port: "2112"
4. Validate metrics are available. go_memstats_heap_inuse_bytes should always be present even with an empty schema.
Key Metrics
Below are some key Weaviate metrics to monitor. Standard CPU, Disk, Network metrics are also useful as are Kubernetes events. Note that some Weaviate metrics will not appear until an operation has occurred (for instance batch operations).
Heap Usage
For heap usage, the expectation is the memory will have a standard jagged pattern underload but that memory will drop periodically due to the Go garbage collection. If memory is not dropping and is staying very close to the GOMEMLIMIT, you may need to increase resources.
go_memstats_heap_inuse_bytes
Batch Latency
Batch latency is important as batch operations are the most efficient way to write data to
Weaviate. Monitoring this can give an indication if there is a problem with indexing data. This metric has a label operation which
allows you to see how long objects, vectors, and inverted index sub operations take. If you are using a vectorizer module you will see additional latency due to the overhead of sending data to the module.
rate(batch_durations_ms_sum[30s])/rate(batch_durations_ms_count[30s])
For batch deletes the corresponding batch_delete_durations_ms metric will also be useful.
Object Latency
Generally, batch indexing is recommended but there are situations where you would do single PUT or DELETE operations
such as handling live changes from a user in an application. In this case you will want to monitor the object latency
instead.
rate(objects_durations_ms_sum{operation="put"}[30s])/rate(objects_durations_ms_latency{operation="put"}[30s])
Query Latency and Rate
The latency and number of queries per second are also important, particularly for monitoring usage patterns.
rate(queries_durations_ms_sum[30s])/rate(queries_durations_ms_count[30s])
rate(queries_durations_ms_count)[30s]
Other Integrations
Many other solutions that have integrations for Prometheus that can also be used:
Ready to start building?
Check out the Quickstart tutorial, or build amazing apps with a free trial of Weaviate Cloud (WCD).
Don't want to miss another blog post?
Sign up for our bi-weekly newsletter to stay updated!
By submitting, I agree to the Terms of Service and Privacy Policy.